Categories
Document Study

Coke Plant Data Analysis: 24-Hour Circular Charts

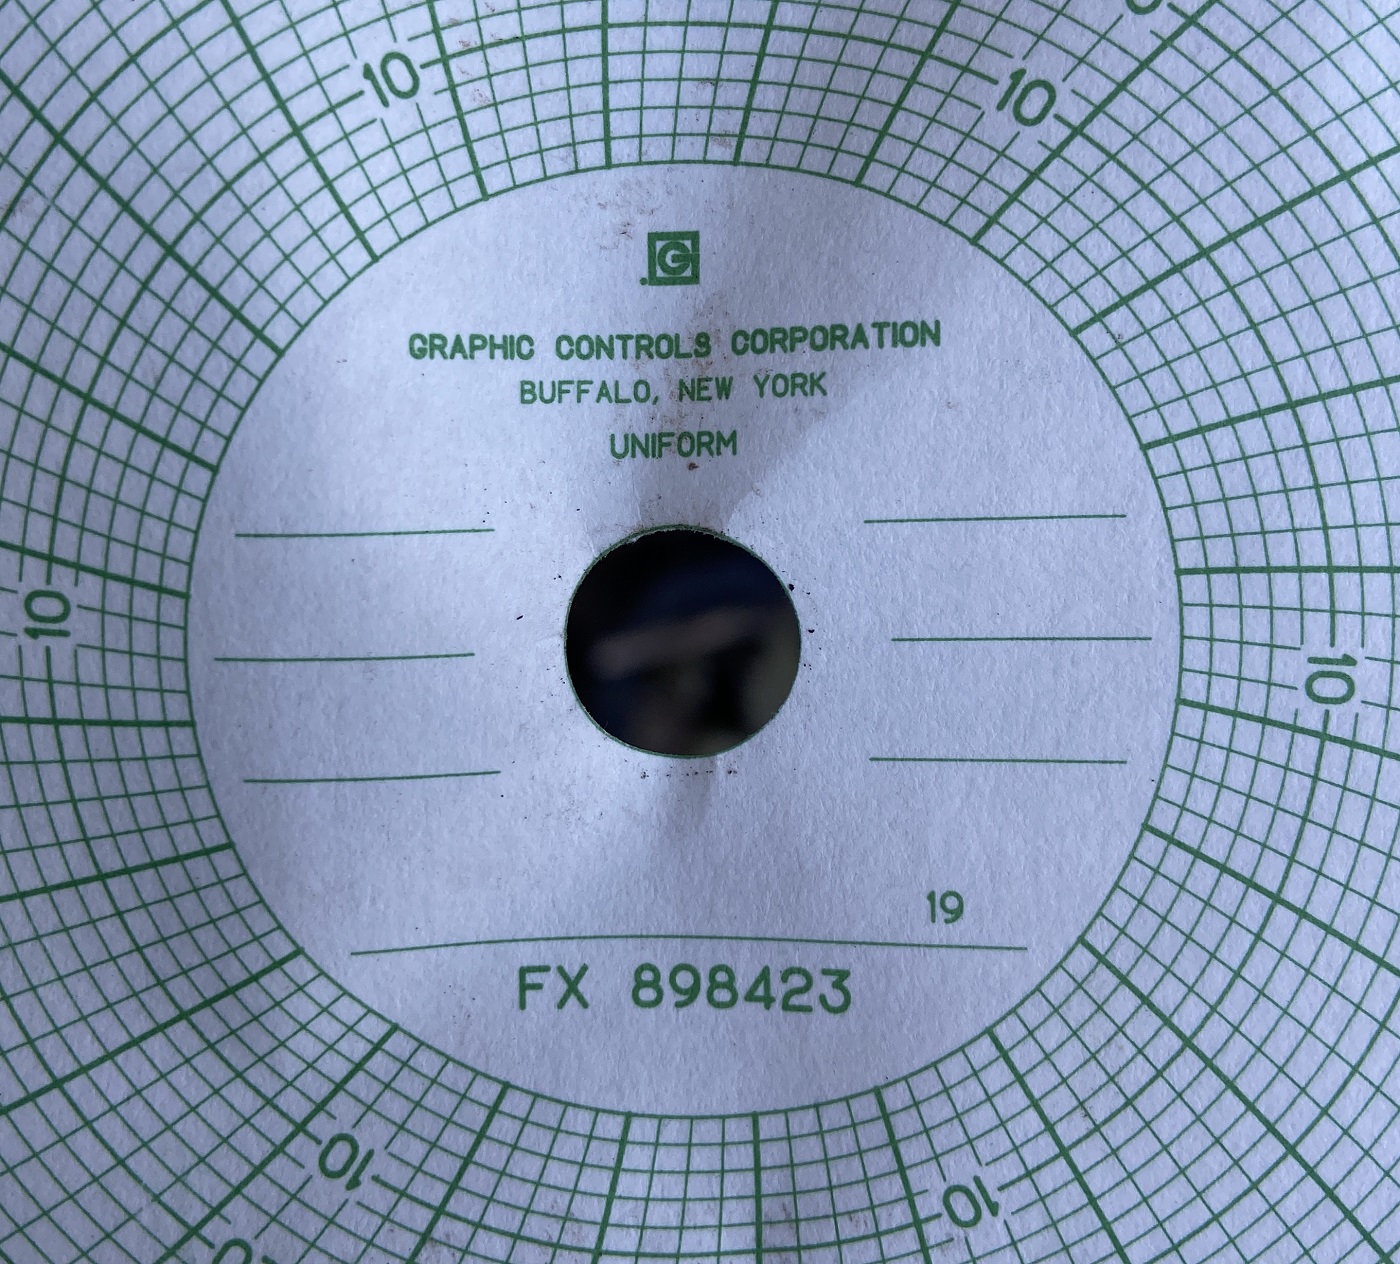
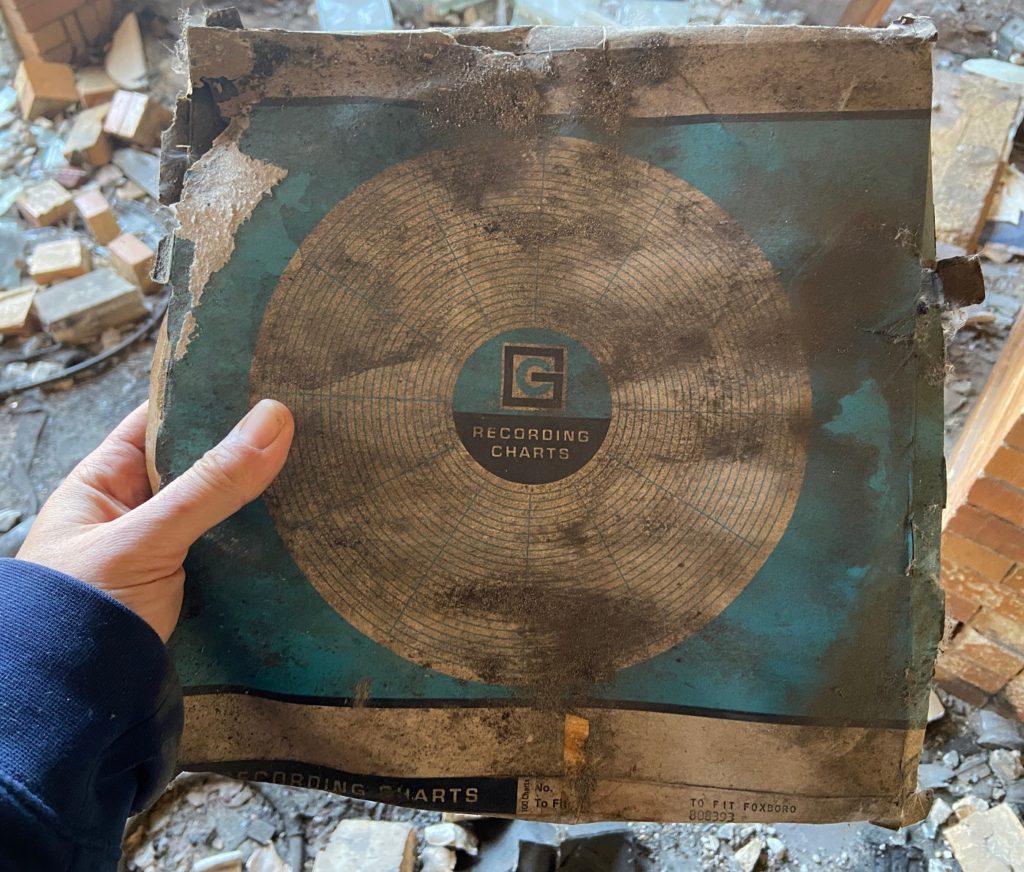
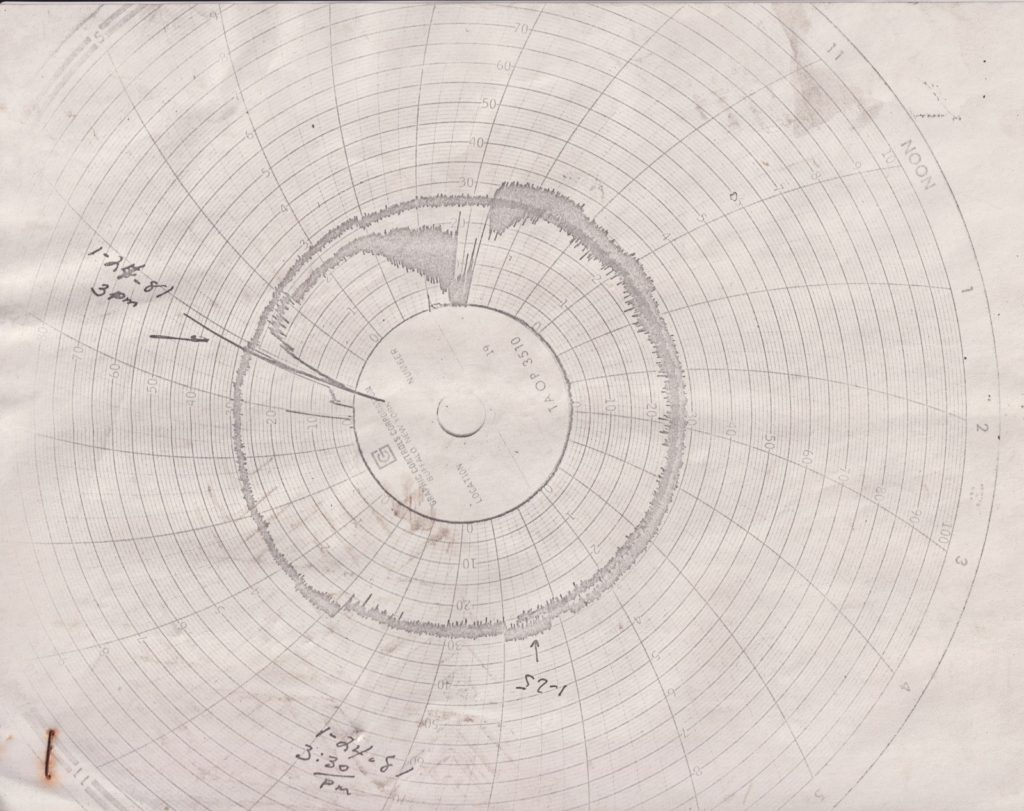
24 hour circular charts were the recording medium of choice at Acme. These charts were used to record a variety of metrics both at the batteries (where recording was done in the coal bunker ground floor) at the BP Plant (charts were stored in the BP Office).

A few brands of charts were used – I found this new pack in the BP office
This pack was found in the electric shop
Copy of chart on Final Cooler pressure, marked up with notes (found in main office).

BP Plant Charts

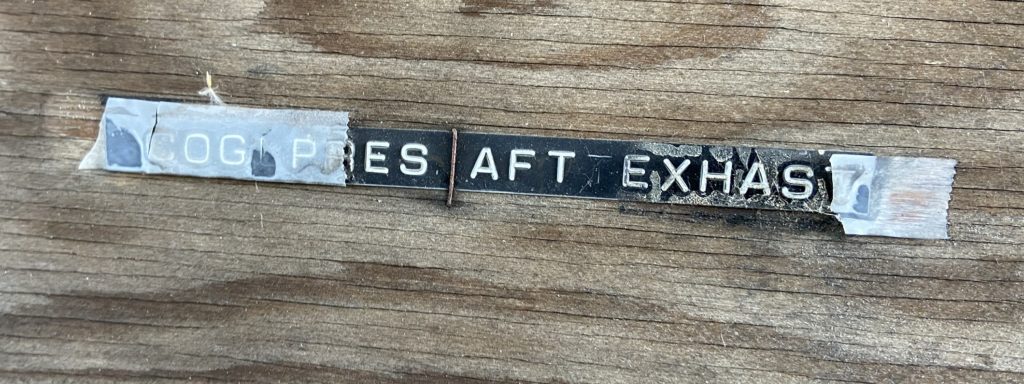
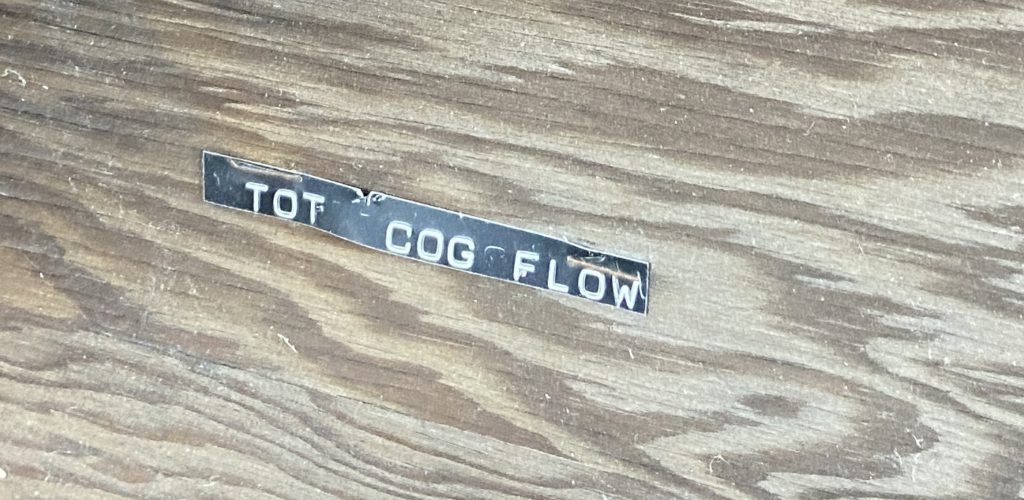
In the BP office a large board is on the north wall of the center room of the building. Spikes were driven into it to hold the circular charts by their centers. The charts are gone, but a label maker was used to mark the chart locations. I found a few in the rubble of the room after a brief search.

Light Oil Still Top/Bottom pressure (inch/Hg)
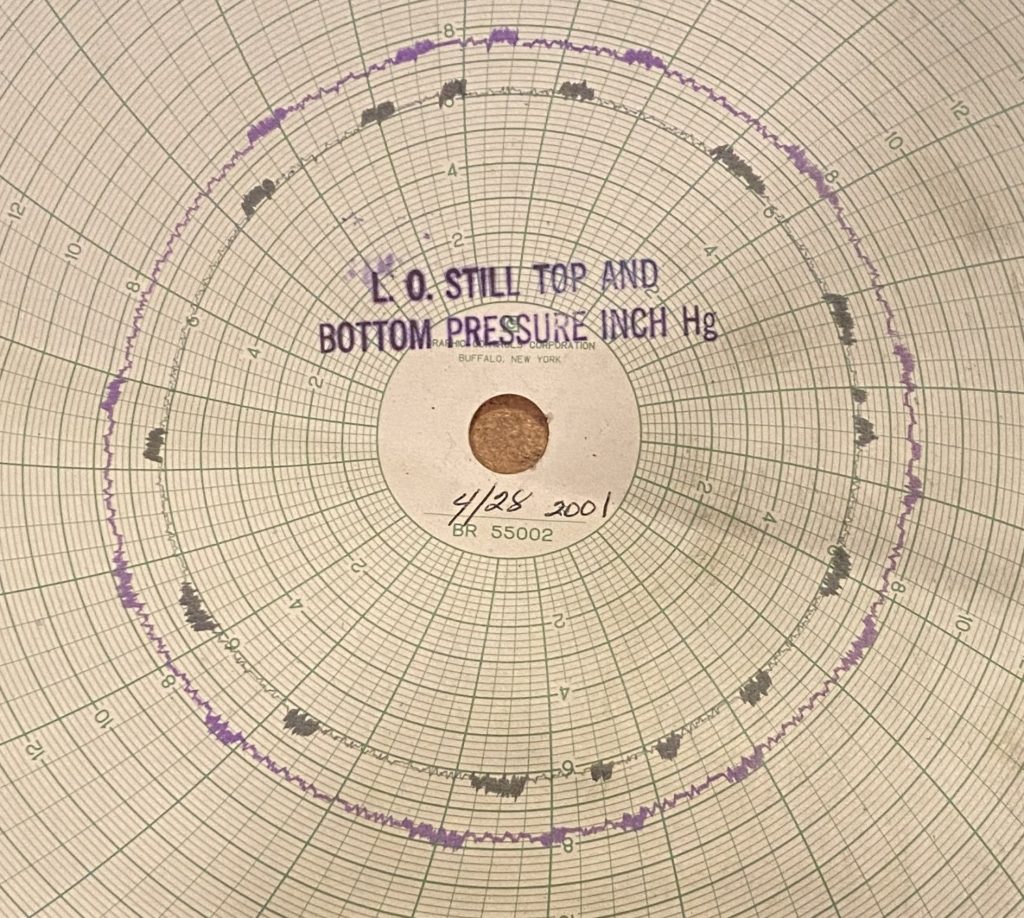
Measurement (in inches of mercury – 1″ = 0.495115 PSI) of differential pressure across the light oil still to indicate:
-the incoming pressure which would be adjusted to maintain a still top temperature for proper distillation;
-the drop across the column to indicate blockage.
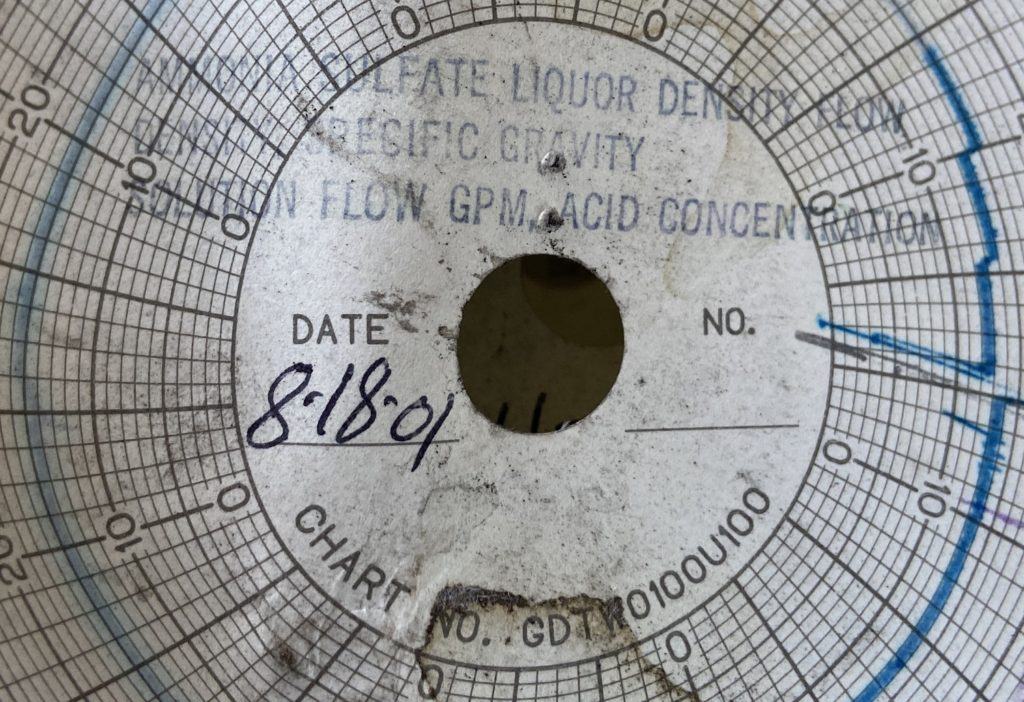
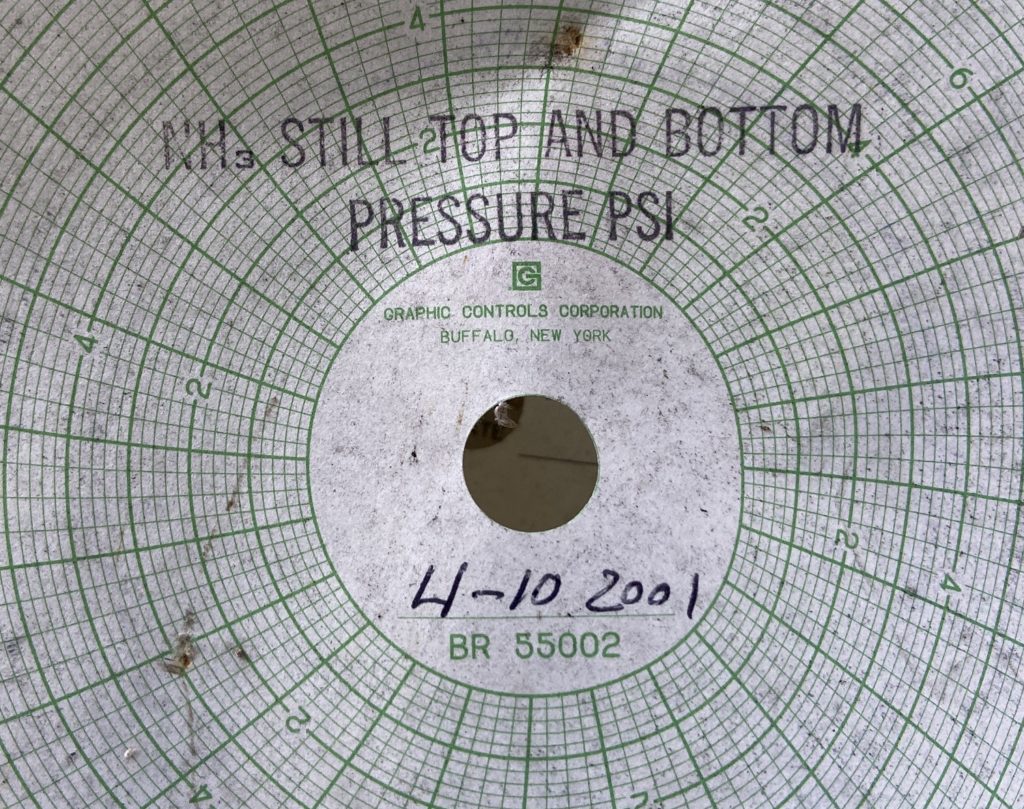
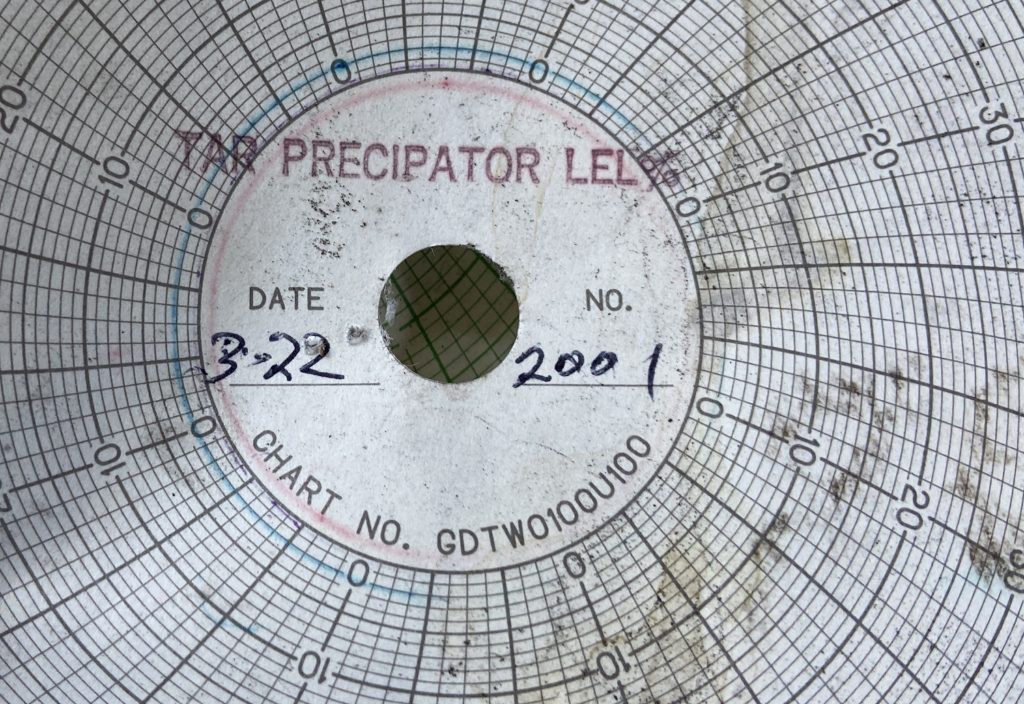
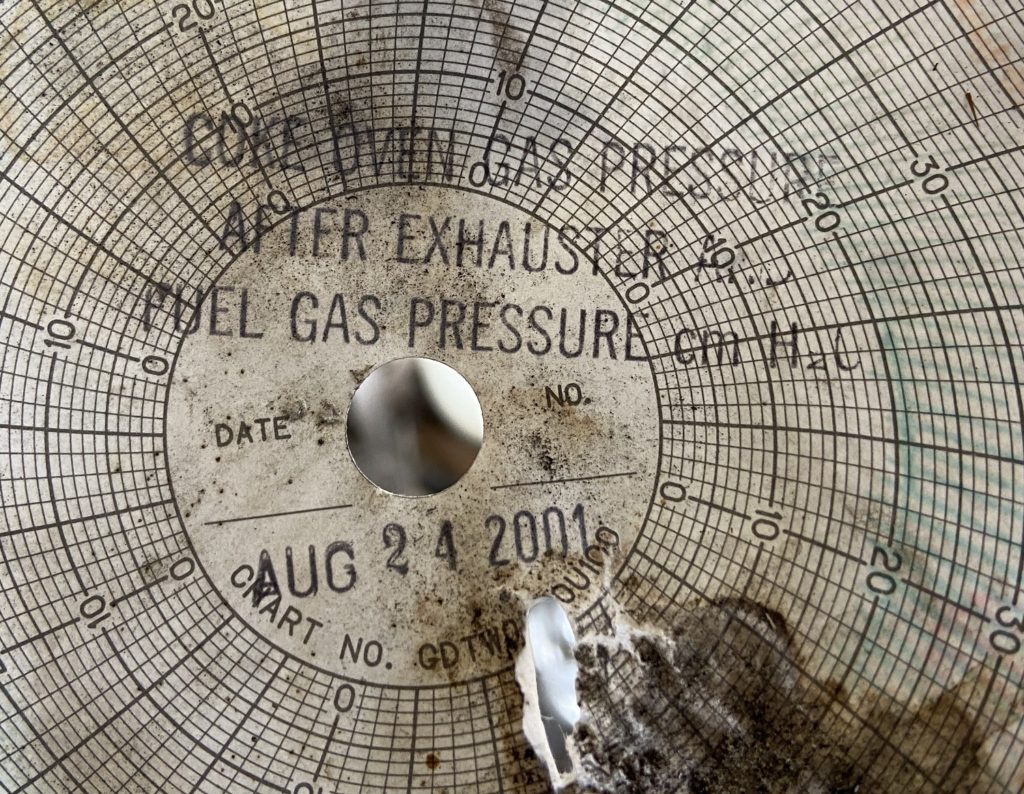
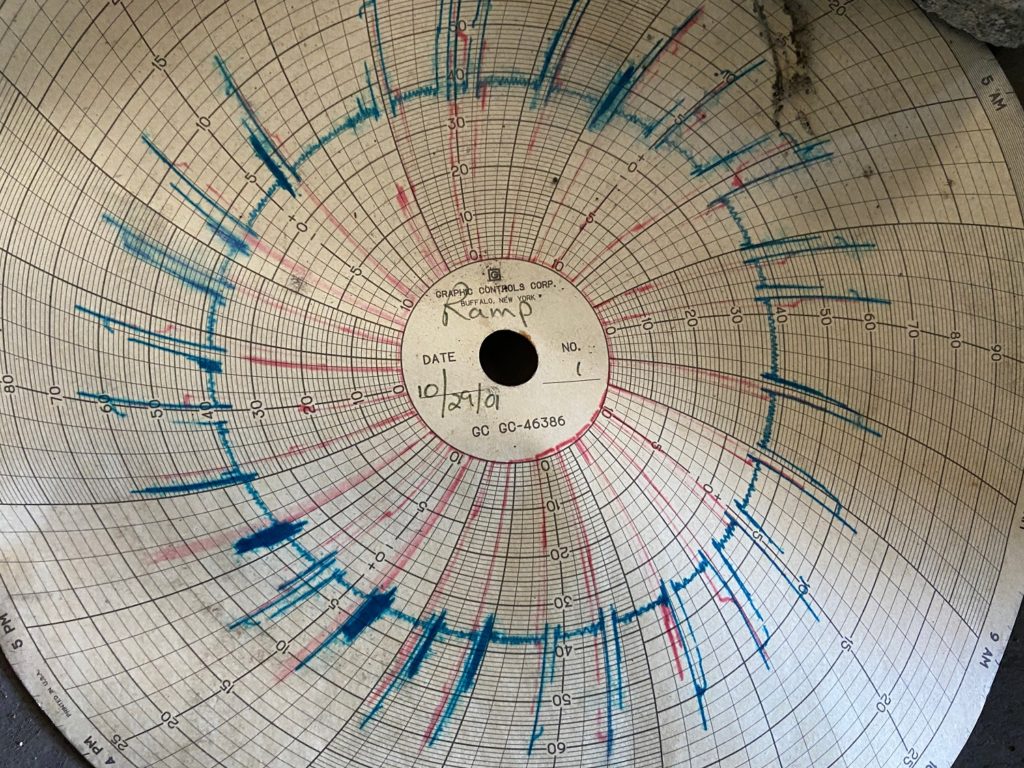
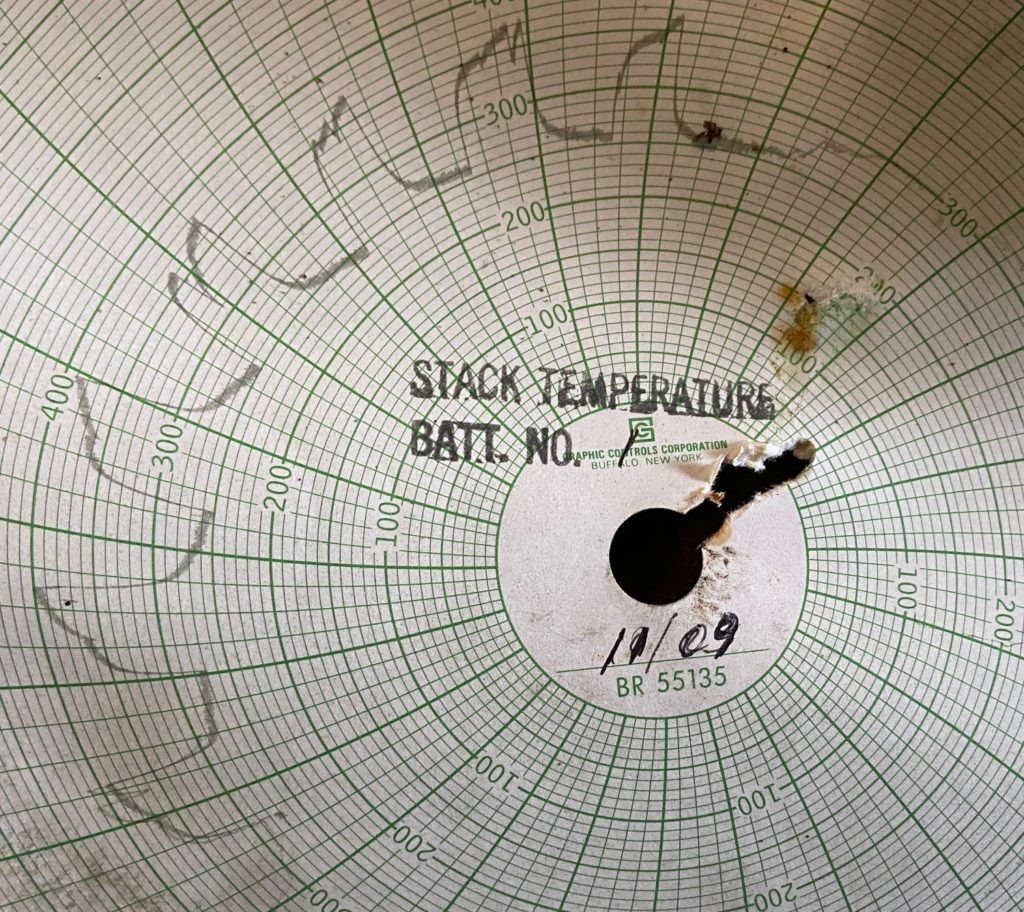
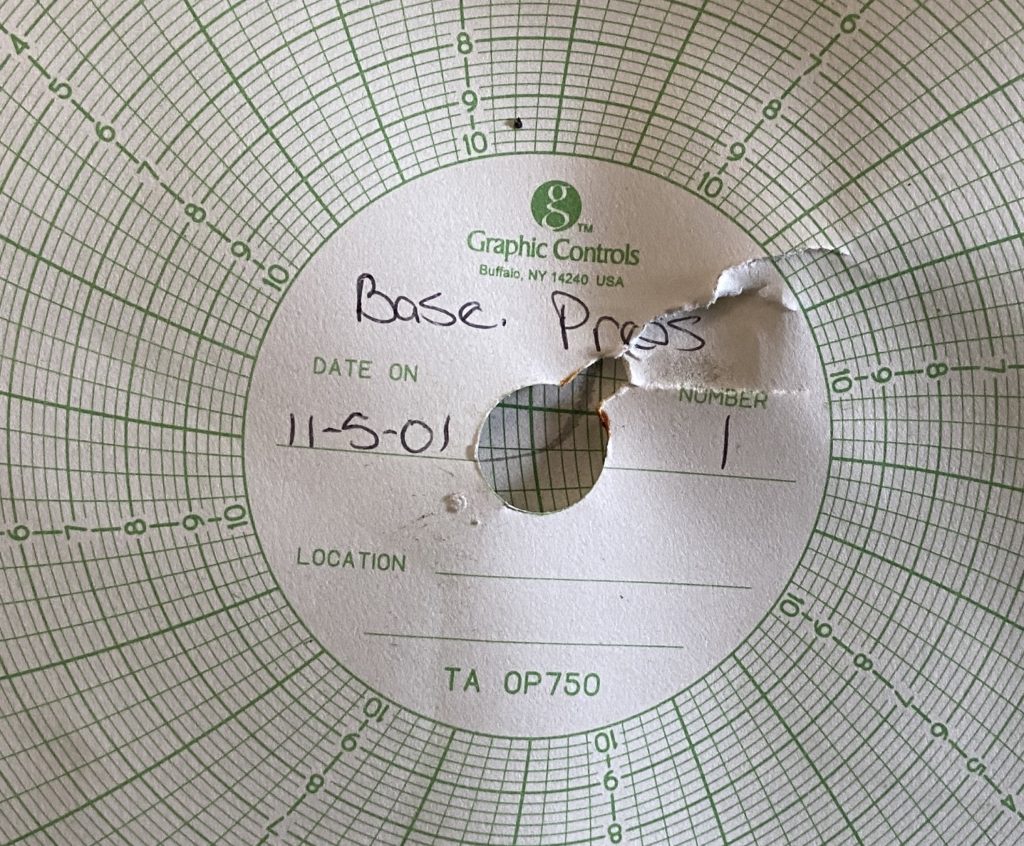
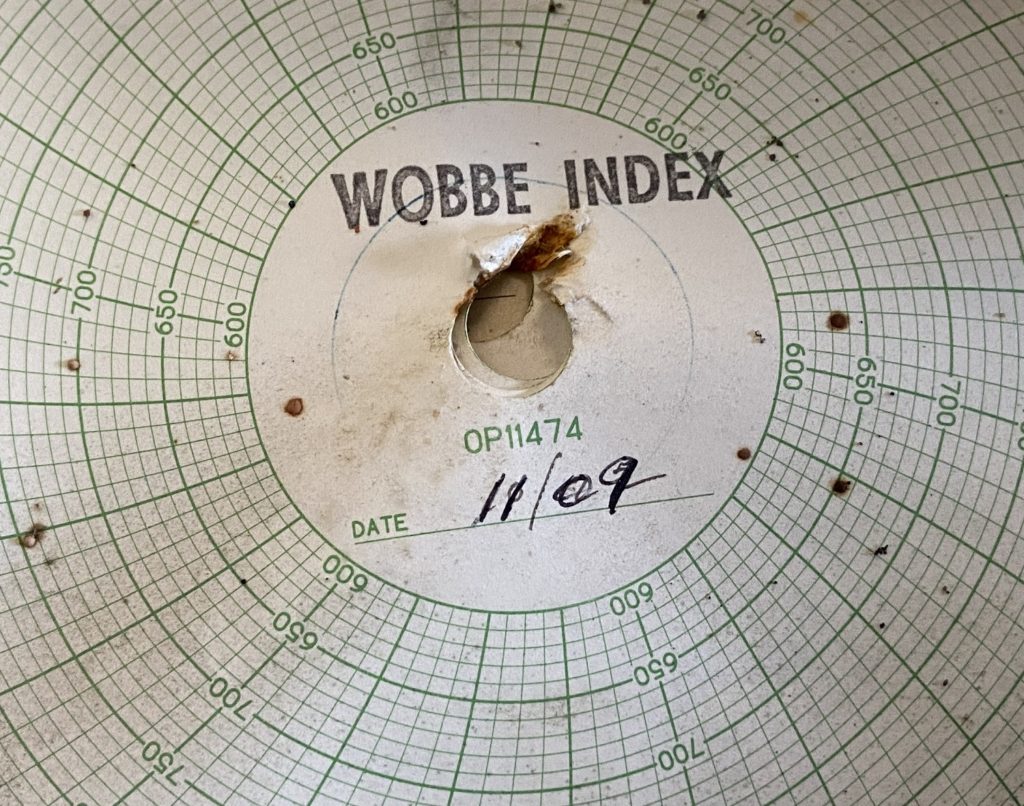
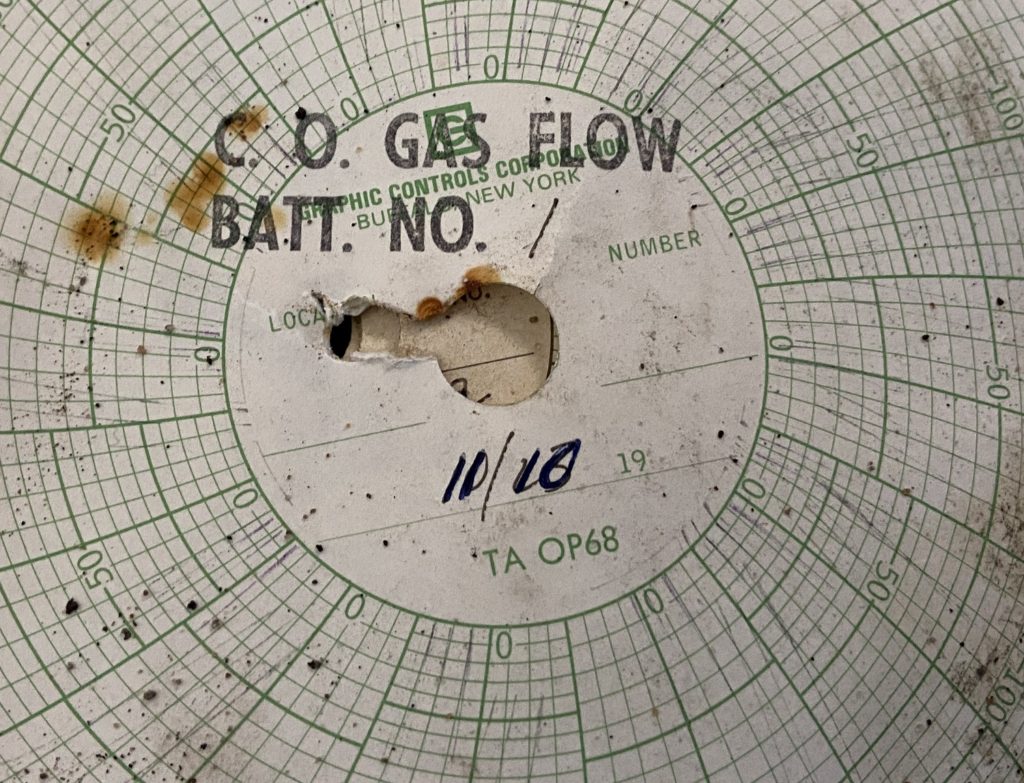
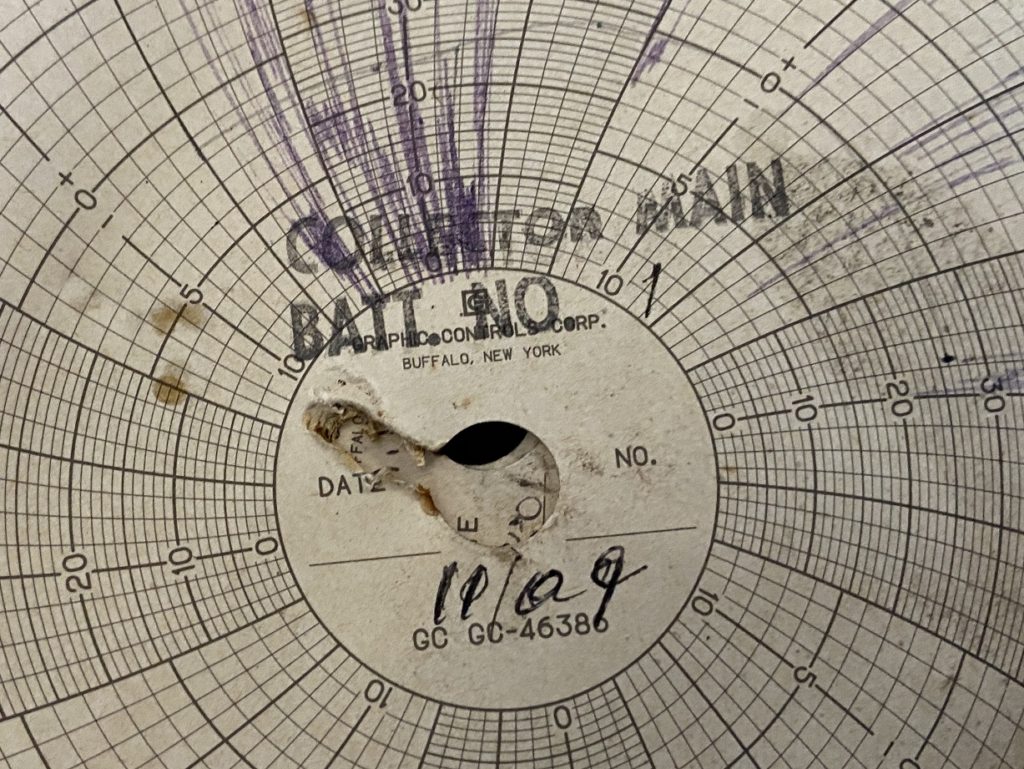
Ammonia Sulfate Liquor Density Flow / Density Specific Gravity / Solution Flow GPM Acid Concentration. Sulfuric acid was used to bond with free ammonia in the COG. This created ammonia sulfate which would have been sold as fertilizer back in the 1960s. Even if not sold for fertilizer, the ammonia must be removed as it is caustic and would destroy the BP plant.
Ammonia Still Top/Bottom Pressure (PSI). Ammonia removed via distillation into a tower, just like homemade moonshine.
Tar Precipitator Level. Like ammonia, tar must be removed as it will gum up the works. It could also potentially be sold for a variety of uses including the roofing industry.

Ovens Dept. Charts

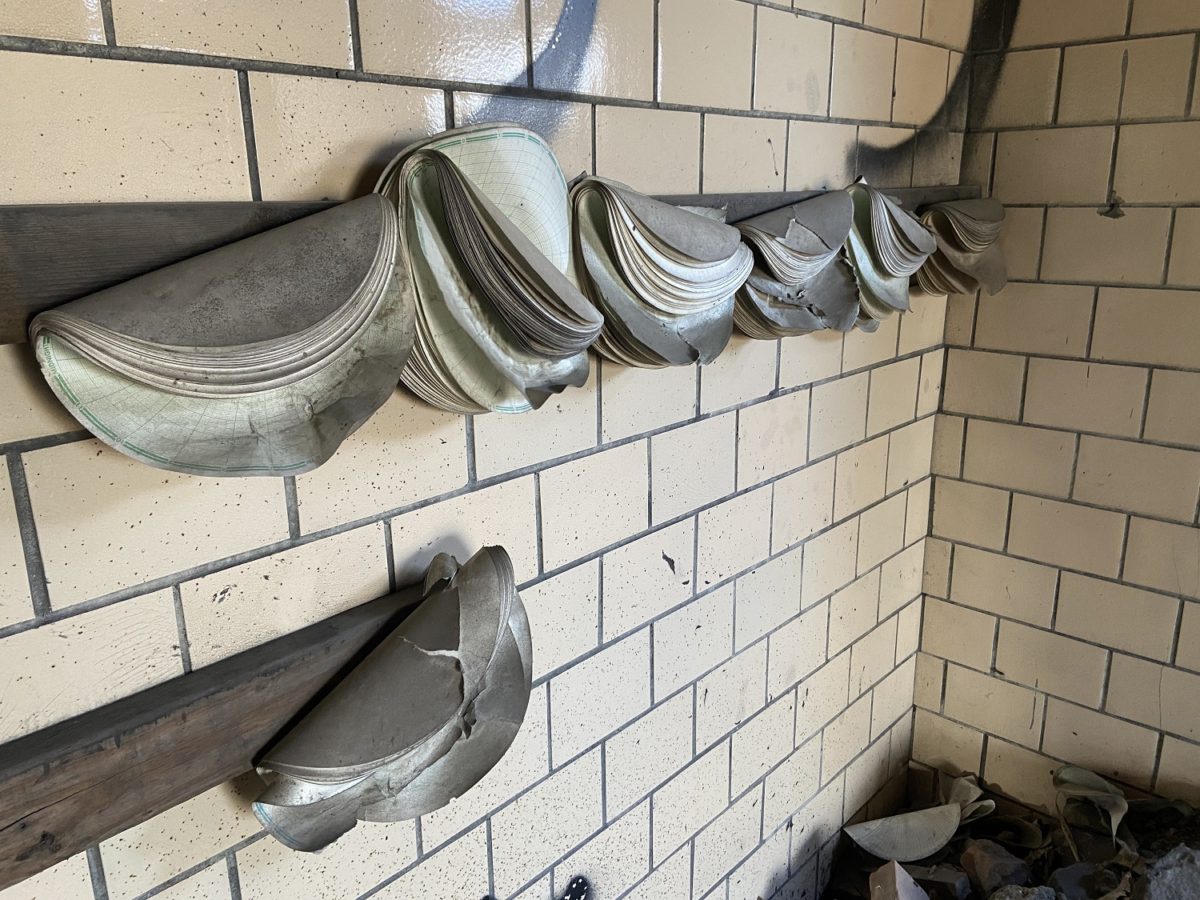
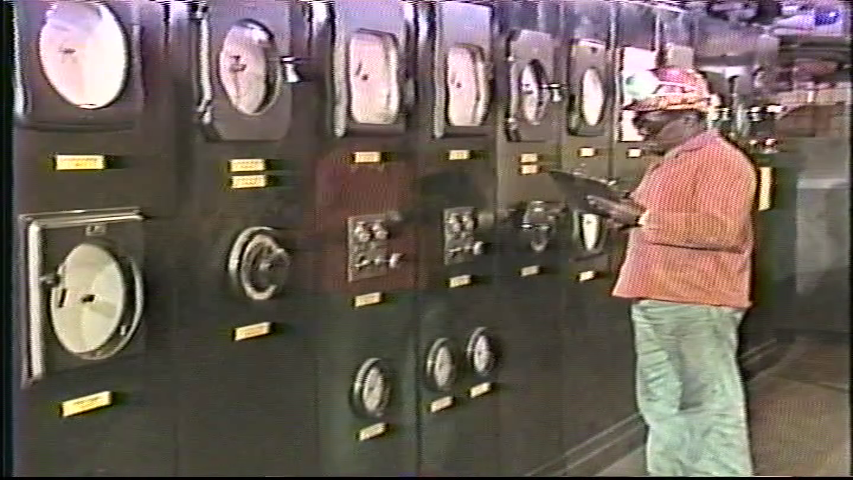
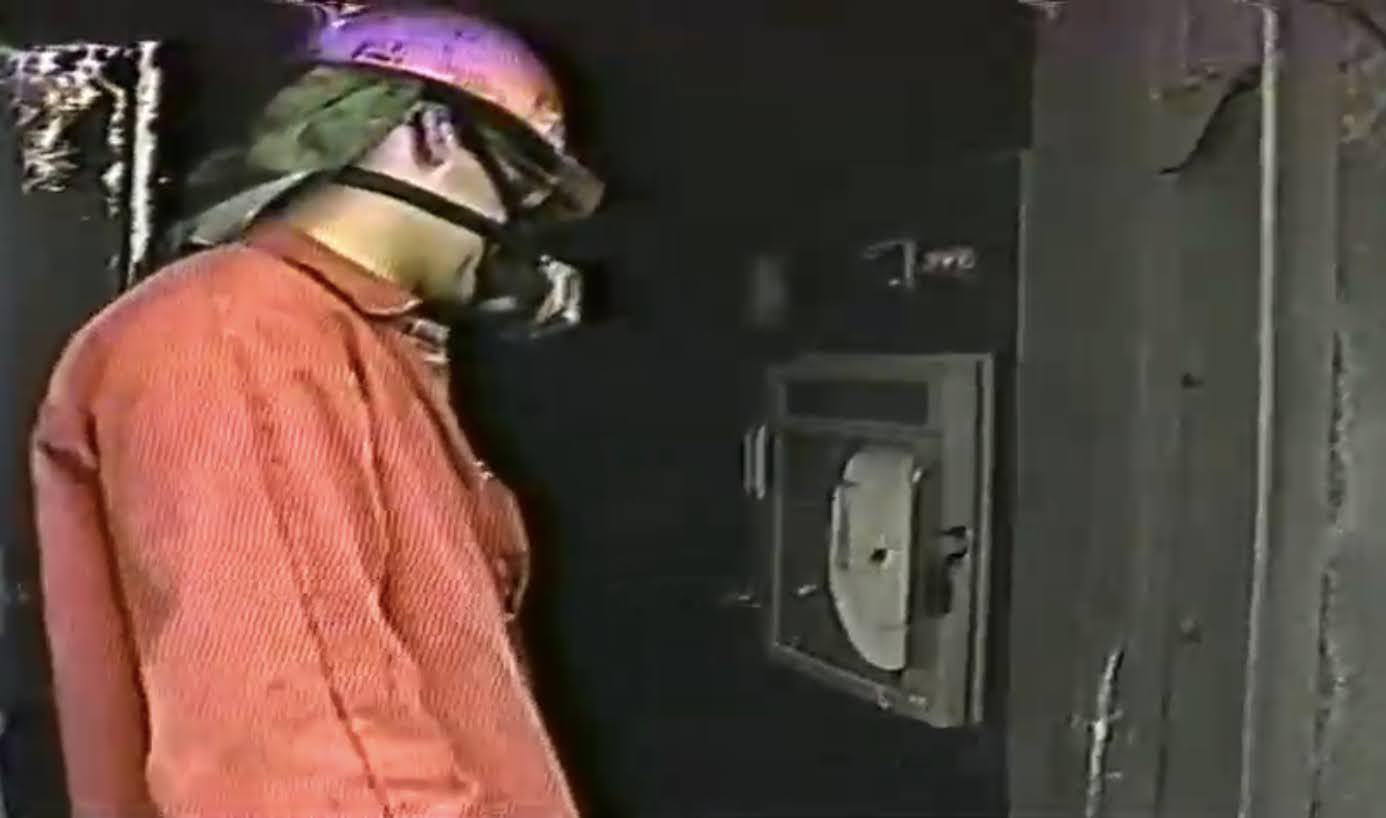
The ground floor of the coal bunker once contained a great many recording devices for circular charts (as seen in the two photos at the top of this post; those photos were taken from the ovens department training video). The charts still hang to this day on the west wall of the east half of the ground floor (a wall bisects the area into two halves). Even more shocking than the fact that they have been hanging there for more than 20 years is that on the outside of the stacks you will find charts from November 2001, some recordings taken only weeks before the plant shut down.

COG Pressure After Exhauster and Fuel Gas Pressure (cm/H2O). Also known as ‘head pressure’. The exhauster pulls COG from the battery through the primary cooler and on toward the rest of the BP plant.
“Ramp” – Measurement of steam pressure when applied to empty oven before charging. Pressure is ramped up to 90 psi when applied to prevent releasing emissions from oven door seal due to pressure spike (without ramping).
Stack Temperature Batt. No. 1. Each battery has it’s own underfire stack which still stand to this day, at over 250′ each.
Basement Pressure Battery #1
Wobbe Index – analysis of COG BTU as a function of it’s specific gravity
COG Flow – Batt. No. 1
Collector Main Batt. No. 1. COG leaves the ovens through the standpipes which then combine to the collector main. This pipeline of sorts leaves the battery, taking the gas to the BP plant and/or the furnace plant via the #4 conveyor bridge.

Leave a Reply

Your email address will not be published. Required fields are marked *