In my document archeology, I often times find a quotation or proposal for a project, then some accompanying notes. Often times these notes seem to be preparation to ‘sell’ the idea of the capital improvement to a superior. Or other times, they may be notes taken while in a meeting with the vendor, who explains why their product is important and useful.
I was fairly sure I had one of these but then I realized, it is the opposite. The quote was on top of a stapled package, and I could see there were some other documents and finally some handwritten notes on notebook paper. But I realize now that the quote is the least important, or perhaps the least interesting thing.
Documents always have more personality when I ‘know’ the person who penned them. When you read enough, you start to feel that way, even if it is artificial. But how can I better know someone than to even know what they look like?

This is Steve Buckner. Mr. Buckner was the instrumentation specialist on the maintenance staff at the coke plant.

I have come across a number of documents not only with Mr. Buckner’s name on them, but also those that he authored. Best of all the videotape I found very early on in my archeology of the plant (from which the “selfie” above was taken). The document for today’s discussion is regarding new instrumentation on the pusher machine to log the current draw while pushing coke from ovens.
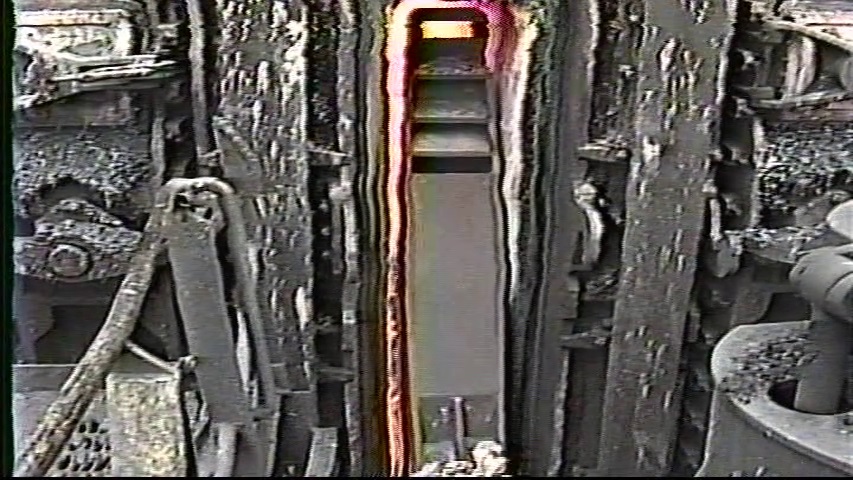
The pusher machine – like all other ovens machinery – was run on electricity. A simple device, it literally pushes the hot coke out of the oven once the doors are removed. The machine and it’s operator have other responsibilities but for this discussion, we want to focus only on that single and very critical task.
As the pusher ram extends into the oven, its current draw fluctuates based on what stage of the ~40 second task is occuring. Rather than explain it, I’ll leave it to Mr. Buckner:

Perhaps I could make the analogy of trying to roll a bowling ball up a hill. When you begin, you will have to work very hard to get the ball rolling. That work load will increase as you climb up the hill. When you reach the flat area at the top, the work load will diminish greatly. Then as you go down the other side, there will be almost no work at all.
Why is it important to measure pushing amperage? The force required to push an oven is made more difficult by a number of factors. There are lots of great papers on the internet I have read on this topic, but why would share those when I have a mountain of texts from Acme? Here is an excerpt from Joe Johnson of Fording Coal Ltd., of Calgary AB Canada:

I have cooked probably 500 pounds of pasta in my life. I used to have a plastic spatula that I would use to stir the pasta to make sure it would not stick together. I used it so many times, I could ‘feel’ the doneness of the noodles through this piece of plastic. I cannot put my hand into the water to check, I would be burned. I used to call this spatula my ‘pasta hand’. (RIP Pasta Hand, it eventually cracked from years of use).
The oven chambers at Acme held about 17 tons of coal. So immense force is required to push it out. Certainly the pusher is up to the task but if there is anything preventing the coke from easily being pushed out, you can’t just exert more and more force, for the reasons listed by Mr. Johnson above. If there is an issue in the oven chamber and you double the force to get a stubborn charge into the quench car, you could damage the chamber terribly. And since you can’t crawl in there to have a look – and since there is no other way to ‘feel’ how difficult it is to get the coke moving, we rely on a measurement of the electricity bring drawn by the machine. That is called current, and it is measured in amperes (‘amps’).

On an oven that truly will not push, the amperage will increase to the point that a circuit breaker is thrown, to prevent additional force which would no doubt damage the oven. Such oven charges, called ‘stickers’, need to be dug out with a armature attached to the pusher. Stickers need to be investigated, as continuing this would no doubt eventually destroy the battery.

Measuring the amperage to determine how easily the coke will push is nothing new and had been around long before 2000 when Mr. Buckner wrote his report. What he wanted was a way to accumulate this data so it could be analyzed, presumably for further preventitive maintanance. Acme had 100 ovens, and each was pushed almost every 24 hours. If the data showed one that consistently was more difficult than others, perhaps the refractory lining needed to be inspected and/or repaired. If during a specific time period over a couple days ALL of the ovens were pushing harder, perhaps a faulty coal blend was expanding (as if such a thing would ever slip by the plant petrographer, Dr. Lin. Of course this is all hypothetical).
Since the pushing machine wasn’t about to have an ethernet cable dangling out of the door, some type of wireless communication would be required to get the data from the machine back into the PC in the coal bunker where it could be stored and viewed. I guess in 2000 WiFi was not yet available for the most part, so a radio frequency modem would be used. The quote calls for a ‘Spread Spectrum Radio Modem’ but does not specify anything more. Turns out that ‘Spread Spectrum’ is not a brand but a type, perhaps something like this:

Now that we have a better understanding of pushing, why current is monitored and how someone might collect that data, and get it wirelessly from the pusher machine to a base station computer we can move onto the fun part.
As I cannot fufill my dream to apply for a job at the plant, I search for ways to contribute. That might seem laughable as there is nothing to contribute to, but in my mind there is and I enjoy it. In Mr. Buckner’s report, he offers an example line graph showing the data plot on a chart.
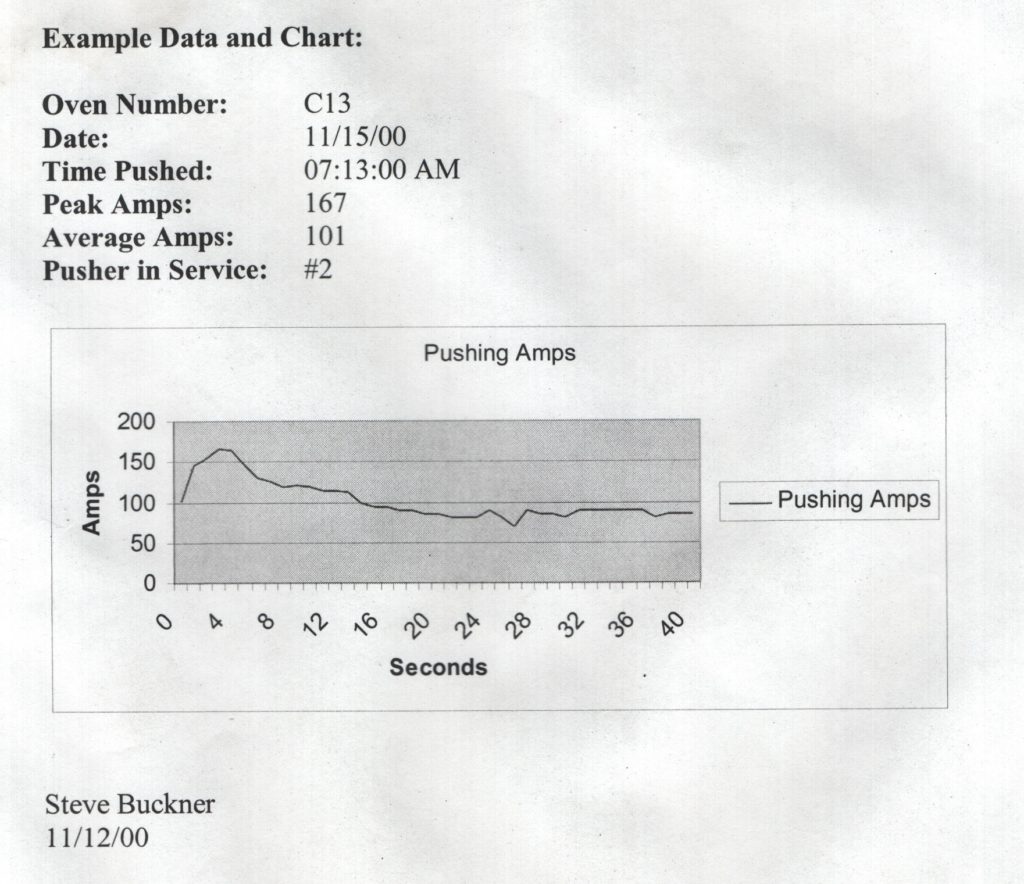
The attached five pages of handwritten notes contain the current consumed during real pushes and the time (measured in seconds, from the beginning of the ram extension).

It seemed to me that Mr. Buckner might appreciate me doing him a favor and inputting his hand written notes into a spreadsheet so that I could produce similar line graphs to the one he offered as an example. So that is exactly what I did. His notes are missing some info so I had to ‘fill in the blanks’ the best I could. I can’t say I blame him, I can only assume he was using a stopwatch and trying to jot things down in real time. I also do not understand why the amps skyrocket at the ‘slow down’ portion of the cycle (when the coke is entirely pushed out of the chamber I assume, or nearly so). So I left that data point off the the spreadsheet.
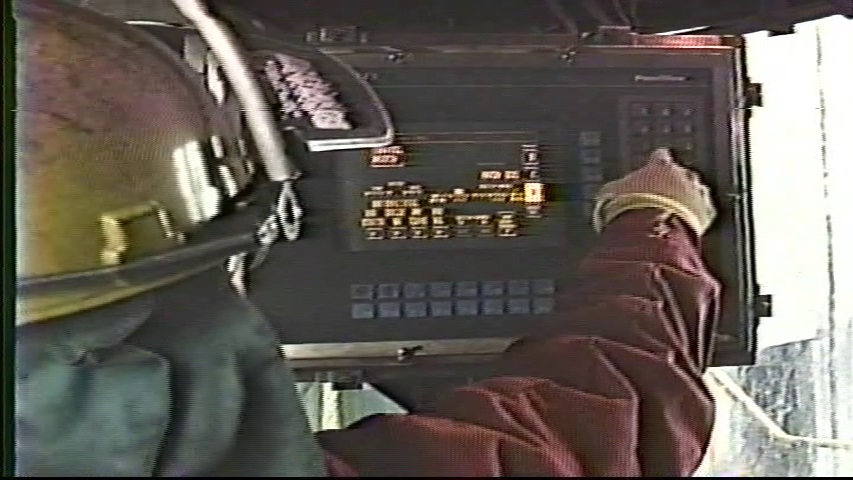
So here they are. Four pages were all from the same day, and the fifth (seen above) was only four additional ovens a week later. It should be noted that the featured image at the top of this post is from 1995 – so the control panel seen there is NOT what is described in this report and quotation. It is however the actual pusher at Acme so I figured it was as relevant as I could get. If you would like to read all of Mr. Buckner’s report, notes and the quotation, that is available here. Otherwise, enjoy my Excel charts, or you can download the XLS and have a look yourself.

